
blastocyst에서 early organogenesis까지 Ex utero monkey embryogenesis.

Abstract
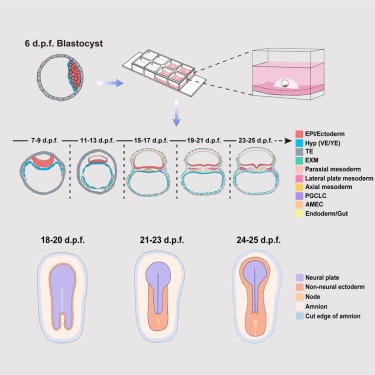
영장류의 gestation 3주와 4주에는 gastrulation과 organ primordia의 형성을 포함한 여러 발달 단계가 있습니다. 그러나 in vivo embryos에 대한 접근이 제한되어 있어 이 시기에 대한 이해는 제한적입니다. 이러한 격차를 해소하기 위해 우리는 수정 후 최대 25일 동안 cynomolgus monkey embryos를 ex utero에서 연장 배양할 수 있는 embedded 3D 배양 시스템을 개발했습니다. Morphological, histological, and single-cell RNA-sequencing analyses 결과, ex utero cultured monkey embryos는 in vivo 발달의 주요 사건을 대부분 요약한 것으로 나타났습니다. 이 플랫폼을 통해 monkey의 neural induction, lateral plate mesoderm differentiation, yolk sac hematopoiesis, primitive gut, and primordial germ-cell-like cell development에 관여하는 lineage trajectories과 유전자 프로그램을 설명할 수 있었습니다. 당사의 embedded 3D 배양 시스템은 monkey embryos를 blastocysts에서 early organogenesis까지 성장시키고 primate embryogenesis를 ex utero에서 연구할 수 있는 강력하고 재현 가능한 플랫폼을 제공합니다.
Figure

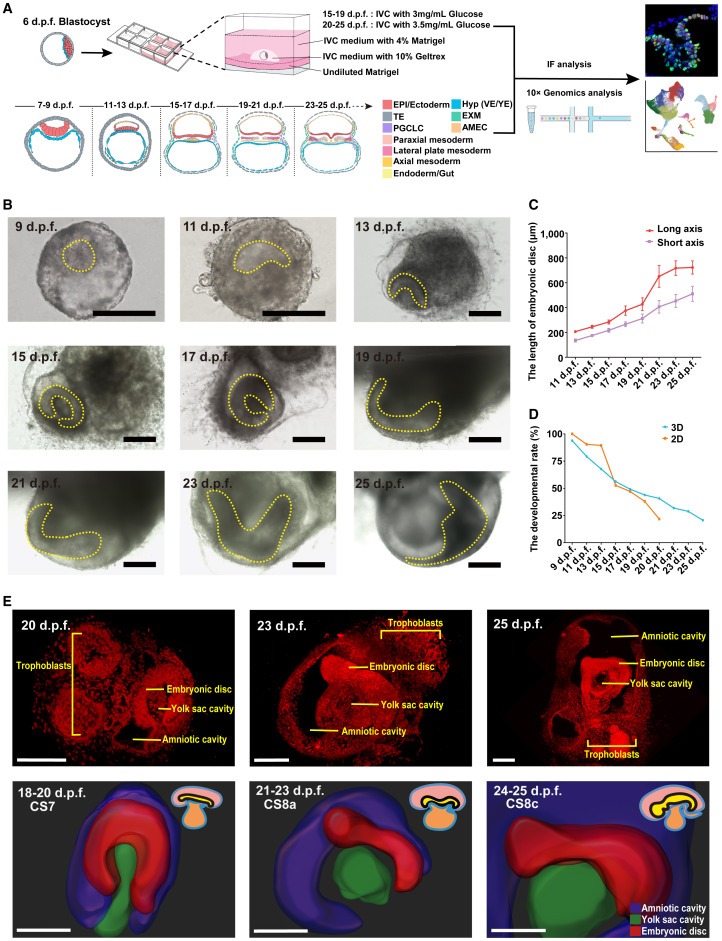
Figure 1. Establishment of monkey ex vivo culture system.
(A) monkey 3D ex vivo 배양 시스템 구축 모식도 및 ex vivo 배양된 embryos의 scRNA-seq 분석.
(B) 수정 후 25일까지 ex vivo에서 배양된 monkey embryo의 Representative brightfield images (d.p.f.)
(C) mbryonic disc의 development 측정.
(D) 3D-cultured monkey embryos 와 2D-cultured monkey embryos의 developmental ratios Dynamics.
(E) propidium iodide으로 염색한 ex-vivo-cultured monkey embryos의 two-photon microscope fluorescent images의 3D 재구성(위쪽 패널); 표면 렌더링은 false color로 생성되었습니다(아래쪽 패널).

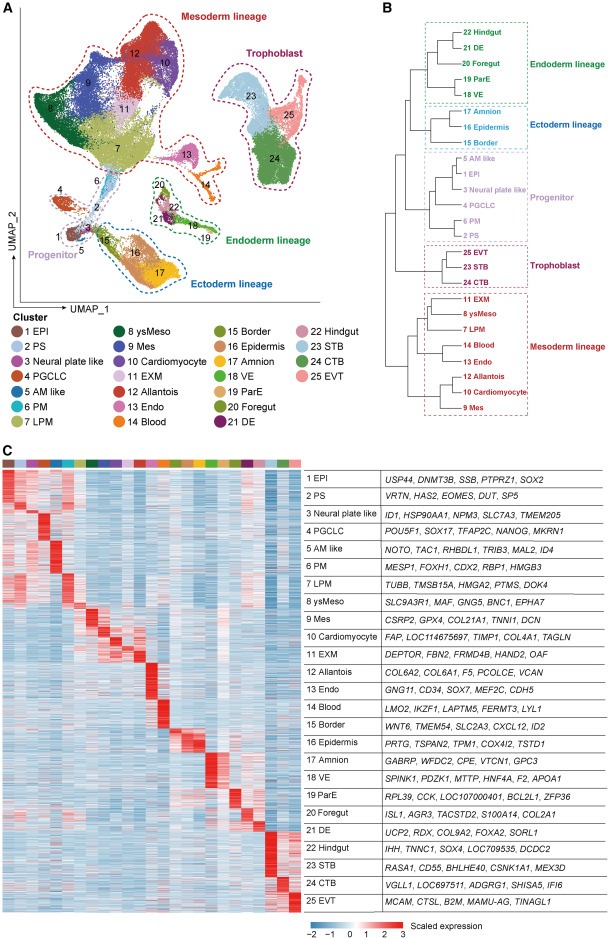
Figure 2 ex-vitro-cultured monkey embryos의 Single-cell transcriptome profiling.
(A) ex vivo monkey embryo의 모든 세포를 보여주는 UMAP plot.
(B) 5가지 major lineages (mesoderm, progenitor, ectoderm, endoderm, and trophoblast)의 hierarchical clustering tree.
(C) 다중 그룹 비교에서 식별된 각 클러스터의 DEG average expression pattern의 Heatmap

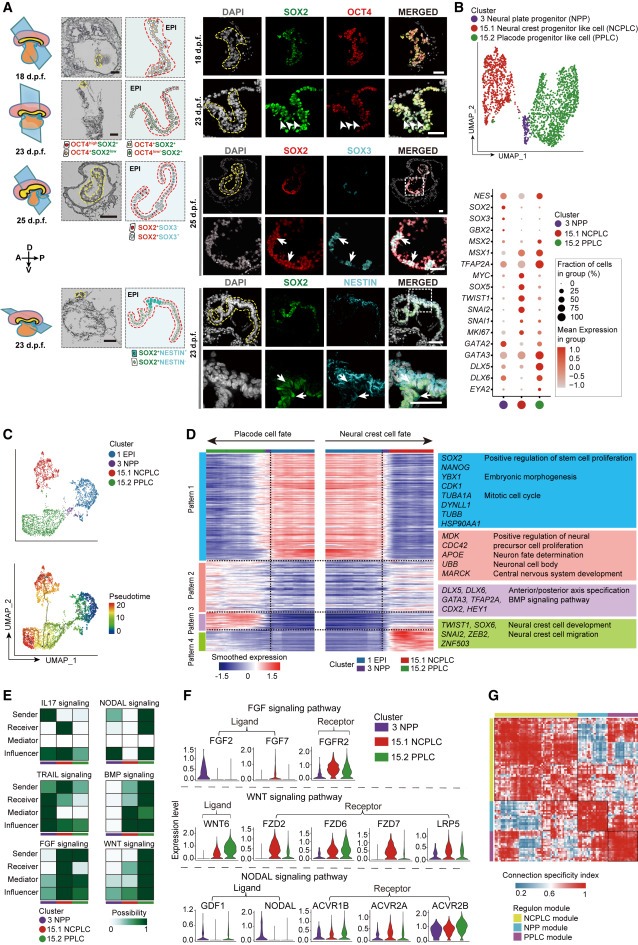
Figure 3. cultured monkey embryos에서의 Early neural development.
(A) SOX2(녹색), OCT4(적색) 및 DAPI(백색)에 대한 표시된 단계의 embryos 섹션에서 indicated stages의 brightfield (BF) 및 immunofluorescence (IF) staining의 Representative images.
(B) 각 클러스터에 대한 마커 유전자 발현을 보여주는 (위쪽 패널) neural-related cell types UMAP 플롯과 (아래쪽 패널) bubble plots.
(C) EPI, NPP, NCPLC 및 PPLC의 진행 상황을 보여주는 Monocle pseudotime trajectory.
(D) representative genes and enriched pathways를 가진 neural-related cells의 developmental trajectory에 따른 Expression pattern dynamics.
(E) representative signaling networks의 계산된 네 가지 network centrality measures을 기반으로 각 셀 그룹의 역할 가능성을 보여주는 Heatmap.
(F) NPP, NCPLC 및 PPLC에서 FGF, WNT 및 NODAL 신호 경로의 representative ligands and receptors의 expression levels을 보여주는 Violin plots.
(G) TF modules of NPPs, NCPLCs, and PPLCs.

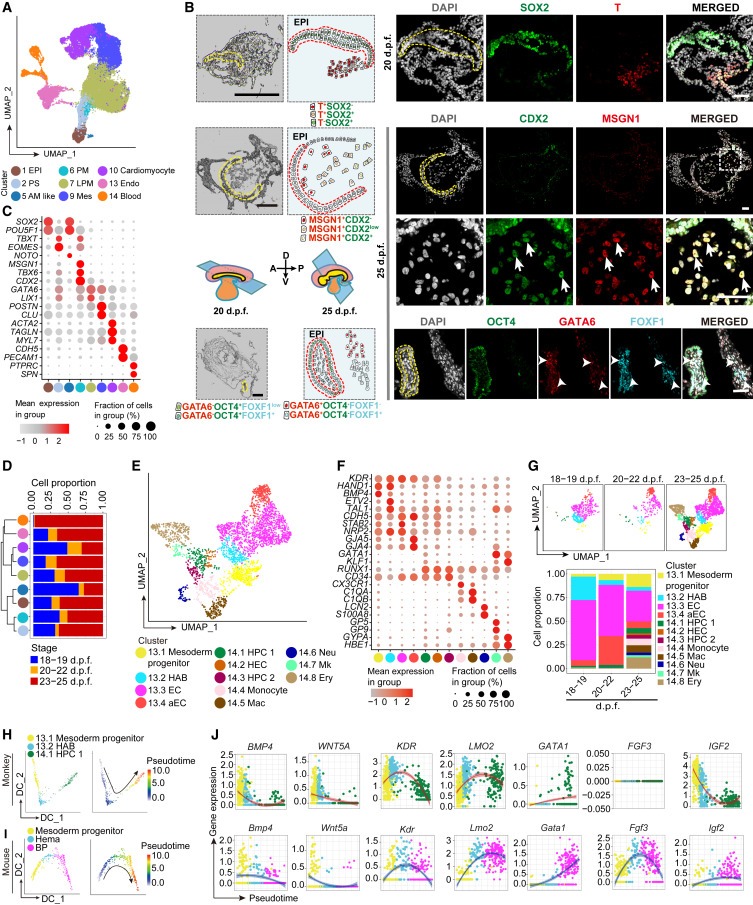
Figure 4 EMEUC embryos의 Mesoderm lineage and hematopoietic specification.
(A) mesoderm의 9가지 주요 세포 유형에 대한 UMAP visualization.
(B) 20 d.p.f. (위쪽 패널), PM (CDX2+MSGN1+) (가운데 패널), 25 d.p.f. (아래쪽 패널) 에서의 EPI (SOX2+T-) 및 PS (SOX2-T+)의 Representative BF 및 IF images.
(C) (A)의 9개 mesoderm clusters에서 key lineage-associated genes의 발현에 대한 Bubble plot overview.
(D) 왼쪽에 cell type similarity의 hierarchical clustering tree가 표시된 (A)의 각 cell cluster에서 샘플링 단계의 비율을 보여주는 막대 그래프.
(E)는 (A)의 엔도 및 혈액 클러스터에 있는 12개의 하위 클러스터를 보여주는 UMAP 플롯.
(F) (E)의 12개 sub-clusters의 feature genes의 expression level을 보여주는 Bubble plot.
(G) 각 샘플링 단계에서 12개 sub-clusters의 비율을 보여주는 UMAP plots (위쪽 패널)과 막대 플롯(아래쪽 패널).
(H) cell types (왼쪽 패널)과 pseudotime (오른쪽 패널)이 mapped된 monkey의 hematopoietic wave의 Developmental trajectory prediction (mesoderm progenitor→HAB→HPC1).
(I) cell types (왼쪽 패널)과 pseudotime (오른쪽 패널)이 mapped된 마우스에서 첫 번째 hematopoietic wave의 Developmental trajectory prediction (mesoderm progenitor →Hema→BP).
(J) monkey(위쪽 패널)와 마우스(아래쪽 패널)에서 첫 번째 hematopoietic wave의 developmental pseudotime를 따라 표시된 conserved and unconserved genes의 발현을 보여주는 Scatterplots.

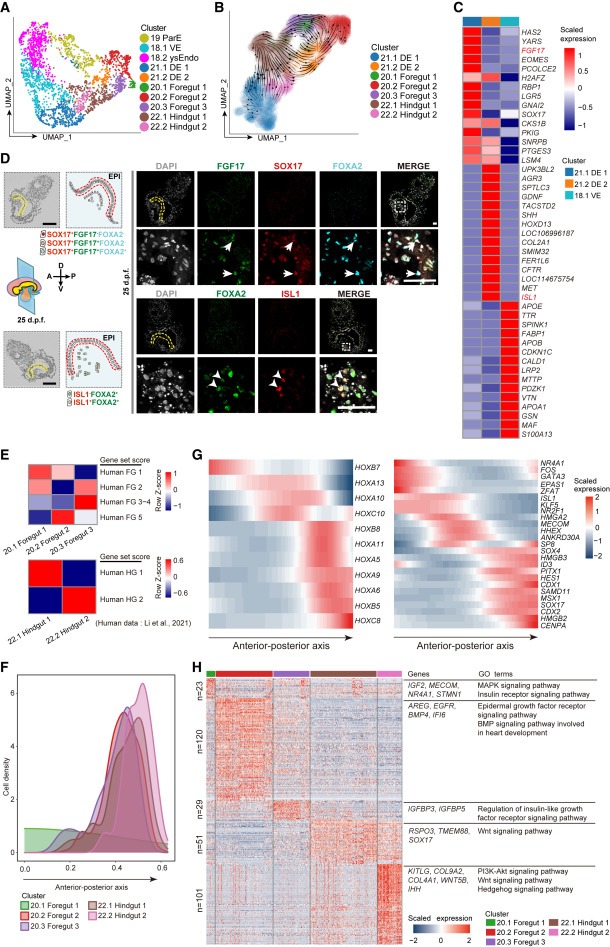
Figure 5. the primitive gut의 Endoderm lineage specification and developmental trajectories.
(A) 모든 endoderm cells의 UMAP visualization.
(B) endoderm lineage specification의 RNA velocity analysis.
(C) DE1, DE2 및 VE 클러스터에 대한 marker genes의 scaled expressions을 보여주는 Heatmap.
(D) FGF17(녹색), SOX17(빨간색), FOXA2(청록색), DAPI(흰색) 또는 FOXA2(녹색), ISL1(빨간색), DAPI(흰색)에 대한 25 d.p.f. embryos의 sections에서 BF 및 IF staining의 Representative images.
(E) monkey gut sub-clusters에서 인간 foregut (FG) 및 hindgut (HG) sub-population signature 점수를 보여주는 Heat maps.
(F) A-P axis를 따라 primitive foregut and hindgut cells의 Pseudo-spatial ordering.
(G) 의사 A-P axis를 따라 scaled HOX genes (왼쪽 패널)와 other representative TF(오른쪽 패널) expressions의 Heatmap.
(H) 각 primitive gut clusters의 DEG 및 related GO terms.

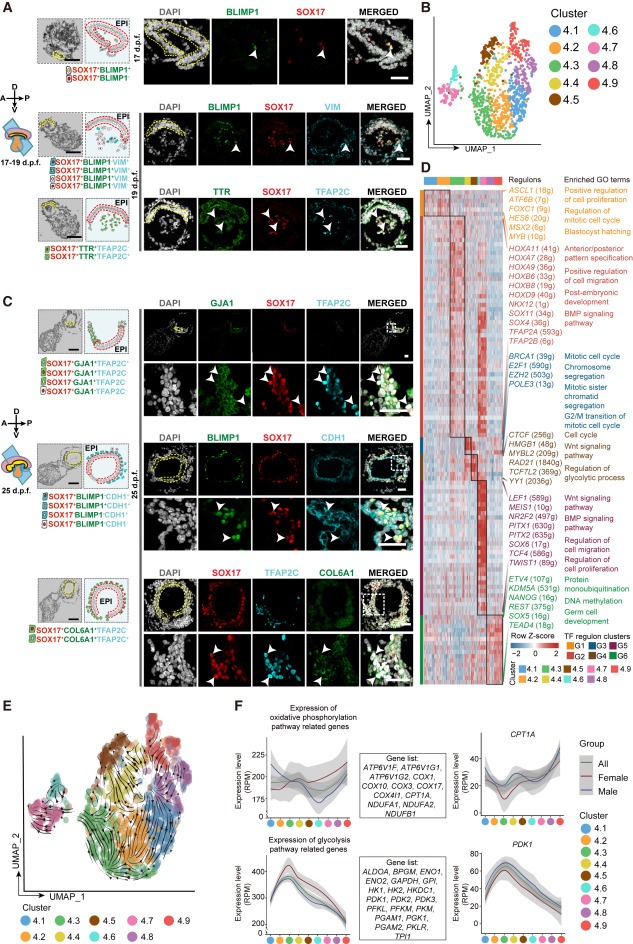
Figure 6. PGCLCs의 Developmental trajectories.
(A) BLIMP1(녹색), SOX17(적색), DAPI(백색)에 대한 17 d.p.f. embryos sections의 BF 및 IF staining Representative images.
B) UMAP plot에 시각화된 PGCLC의 클러스터링.
(C) 클러스터 4.2, 4.3 및 4.7 PGCLC를 식별하기 위해 embryos sections에서 25 d.p.f.에서 BF 및 IF staining Representative images.
(D) PGCLC 클러스터(클러스터 4.1-4.9)에서 6개의 regulon groups (G1-6)을 보여주는 Heatmap.
(E) PGCLC의 developmental trajectory을 보여주는 RNA velocity analysis.
(F) male and female PGCLC에서 oxidative phosphorylation (OXPHOS) 및 glycolysis-related genes (블랙박스 안에 나열)와 epresentative genes CPT1A(OXPHOS gene) 및 PDK1(glycolysis gene)의 시간 경과(클러스터 4.1-4.9)에 따른 상대적 발현량입니다.

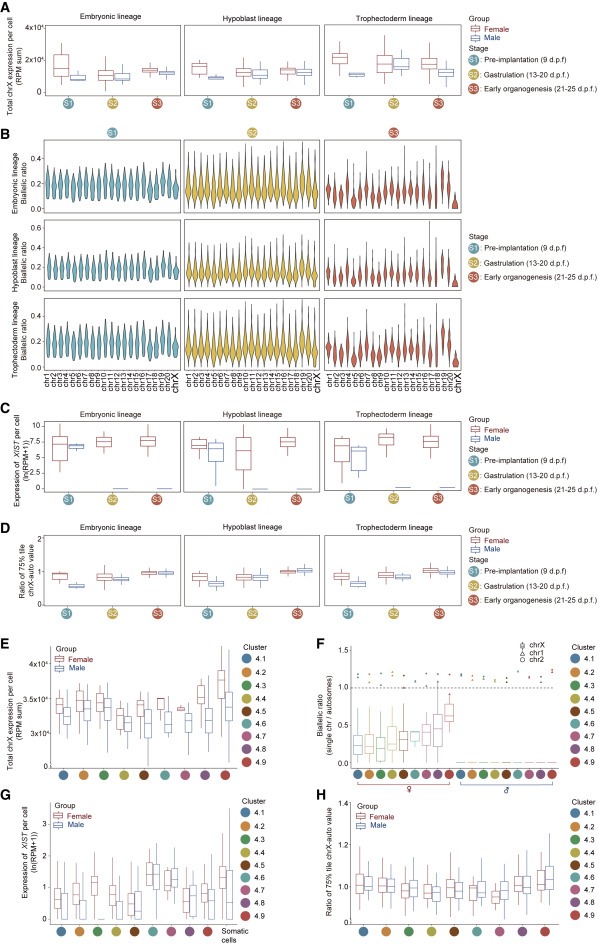
Figure 7. embryonic, extraembryonic, and PGCLC lineages의 X chromosome dosage compensation.
(A) fixed gene set을 사용하여 각 sex and cell lineage에서 세포당 X-linked gene expressions의 합을 보여주는 Boxplots.
(B) embryonic and extraembryonic lineages에서 autosomal (1번 염색체~20번 염색체) 및 X chromosome에 대한 female cell 당 biallelic ratio 분포를 보여주는 violin plots.
(C) 표시된 development stage에서 male and female embryonic and extraembryonic lineages에서 XIST의 발현.
(D) male and female embryonic and extraembryonic lineages에서 X chromosome대 autosome expression (X:A) 비율.
(E) fixed gene set를 사용하여 각 성별 및 PGCLC 클러스터에서 세포당 X-linked gene expressions의 합을 보여주는 Boxplots.
(F) 각 클러스터의 세포당 autosomes 대비 X chromosome (chrX)의 biallelic ratio (biallelic chrX SNV ratio/biallelic autosomal SNV ratio)의 분포를 보여주는 Boxplots.
(G) 각 클러스터의 male and female PGCLC와 endoderm somatic cells에서 XIST의 발현.
(H) 각 클러스터의 male and female PGCLC의 X:A 비율.
Disscussion
이전에는 monkey blastocysts가 in vitro에서 peri-gastrulation stages (∼20일)까지 성장할 수 있도록 지원하는 2D attachment culture system을 보고했지만, 모든 cultured embryos 가 massive cell apoptosis로 인해 이 단계 이상으로 발달하지 못했습니다. 여기에서 우리는 monkey embryos를 in vitro에서 early organogenesis stages (∼25일)까지 장기간 발달시킬 수 있는 EMEUC라는 embedded 3D 배양 시스템을 개발했습니다. 이 시스템은 Geltrex and Matrigel을 mechanical support로 사용하고 glucose를 추가 에너지 공급원으로 사용했습니다. 이러한 최적화는 developmental ratio를 극적으로 개선하고 장기간 배양하는 동안 monkey embryo의 structural integrity를 유지하는 데 도움이 되었습니다. 이러한 개선에도 불구하고 neural, axial mesoderm, and paraxial mesoderm lineages의 발달이 불충분한 등 EMEUC-cultured embryos and in vivo embryos 사이에는 여전히 눈에 띄는 차이가 존재합니다(그림 S7).
primitive erythrocytes, megakaryocytes, and macrophages를 생성하는 hematopoiesis의 first wave는 생쥐의 경우 embryo 7.25일경에, 영장류의 경우 CS7-8(16-18.5 d.p.f.)에 yolk sac에서 시작됩니다 얼마 지나지 않아 second wave of hematopoiesis가 나타나 영장류에서 YSMP가 생성됩니다(생쥐의 EMP에 해당할 가능성이 높음). 현재까지 early embryos에 대한 접근성이 제한되어 영장류의 first wave of hematopoiesis에 대해서는 알려진 것이 거의 없습니다. early human hematopoiesis에 대한 first glimpse는 최근 단일 CS7 인간 embryo에 대한 scRNA-seq 분석을 통해 이루어졌습니다. 그러나 hematopoietic progenitor cells의 major second wave가 포착되어 분석되었습니다. 대조적으로, 이 연구에서 EMEUC-cultured monkey embryo는 yolk sac hematopoiesis의 both waves를 모두 요약했습니다. 또한 분석 결과 monkey와 생쥐의 yolk sac hematopoiesis의 first wave 동안 FGF3 및 IGF2의 발현 패턴과 같은 차이를 발견했으며, 이는 yolk sac structure and/or early development의 종 차이에 기인할 가능성이 높습니다.
배양된 monkey embryo에서 Axial and paraxial mesoderm lineages는 아직 progenitor stage에 있었고, intermediate mesoderm은 우리의 scRNA-seq 데이터 세트에서 검출되지 않았습니다. As axial and paraxial mesoderm은 neural ectoderm의 형성을 유도하는 데 도움이 되므로, 이들의 underdevelopment은 EMEUC-cultured monkey embryo에서 early stage of neural development를 설명할 수 있습니다. 다른 척추동물을 대상으로 한 이전 연구에 따르면 growth factor gradients가 mesoderm patterning에 중요한 역할을 하는 것으로 나타났습니다. 예를 들어, 높은 수준의 BMP는 LPM 운명을 활성화하는 반면, 낮은 BMP 수준은 intermediate mesoderm fate를 유도합니다. axial and paraxial mesoderm formation에도 FGF gradients가 필요합니다. 배양된 monkey embryo에서 mesoderm and neural lineages의 further maturation을 촉진하려면 microfluid devices를 사용하는 등 in vivo growth factors gradients를 보다 면밀히 시뮬레이션하는 전략이 유용할 수 있습니다.
이전 보고에 따르면 VE가 생쥐의 gut development에 기여하는 것으로 나타났지만, 영장류에서는 아직 밝혀지지 않았습니다. 우리의 결과는 최근의 in vivo 연구와 일치하여 VE가 monkey의 primitive gut formation에도 기여한다고 예측합니다. 또한, 우리의 데이터 세트에서 primitive gut에서 HOX 유전자의 posterior expression만 관찰되었으며, 이는 생쥐의 연구와 일치하여 HOX 유전자가 monkey의 A-P axial patterning을 유발하지 않음을 시사합니다. 따라서 gut tube의 cell origins와 A-P patterning은 두 종간에 conserved 될 가능성이 높습니다. 앞으로 lineage tracing과 spatial omics 연구를 결합하면 primate primitive gut development의 기초가 되는 분자 및 세포 메커니즘을 해부하는 데 더욱 도움이 될 것입니다.
영장류의 X chromosome dosage compensation에 대해 두 가지 모델 (XCI 및 XCD)이 제안되었습니다. 현재 연구에서 우리는 세포 당 총 X chromosome gene expressions과 biallelically로 발현되는 X-linked genes의 비율이 모두 발달하는 동안 female 세포에서 감소하는 것을 관찰하여 초기 발달 동안 monkey embryo 및 embryo 외 세포에서 XCI에 대한 증거를 제공했습니다 10× technology의 시퀀싱 깊이로는 명확한 결론을 내리기에는 충분하지 않을 수 있으므로 향후 영장류의 초기 XCI 모델을 명확히하는 데 full-length scRNA-seq이 도움이 될 것입니다. EMEUC-cultured monkey embryo에서 PGCLC의 X chromosome gene expression dynamics를 분석한 결과, female and male PGCLC에서 각각 putative XCR과 XCU를 발견했습니다. 흥미롭게도, XCD는 이전에 gonads에 colonization 된 후 인간 female PGC에서 관찰되었습니다. XaXIST+로 명명된 XIST를 발현하는 active X chromosome은 최근 인간 pre-implantation embryos에서 관찰되었으며, 이는 우리 연구에서 PGCLC의 하위 집단 (클러스터 4.6 및 4.7)에서도 발견되었습니다. 이러한 관찰과 다른 관찰은 영장류 PGC development 중 X chromosome dose compensation 조절에 관여하는 복잡한 메커니즘을 가리킵니다.
요약하면, embedded 3D 배양 시스템을 활용하여 영장류 embryo를 early organogenesis까지 장기간 ex utero 배양하는 데 성공했습니다. monkey ex utero embryogenesis는 영장류의 gastrulation 단계를 넘어서는 주요 발달 사건을 해부하기 위해 쉽게 accessible, tractable, and perturbable한 플랫폼을 제공합니다. 이 연구는 비인간 영장류 종의 early organogenesis를 뒷받침하는 세포 및 분자 역학에 대한 통찰력을 제공하며, 이는 인간의 발달 기형과 임신 초기 손실의 원인을 이해하는 데 도움이 될 것입니다.